
Introduction to JMeter
The Apache JMeter is 100% pure open-source software, You can use JMeter to analyze and measure the performance of web applications or different services. Performance Testing means checking the speed of web applications in different situations by increasing the number of users(heavy load) at a time, multiple and concurrent user traffic. JMeter is designed for testing Web Application or FTP application.
Features of JMeter:
- It is open-source software for testing and also free of cost.
- It is a completely multi-threading framework that allows concurrent sampling by many threads.
- It has a simple GUI. So, that user can use it easily. Hence, the user can run on any platform
- It is Platform independent.
- It is also known as all in one tool, We can do functional and no-functional both testing by using the Jmeter tool.
- It supports various protocols like HTTP, FTP, SOAP, JDBC, JMS, and LDAP. We can also use the tool for testing the performance of your database.
Performance Testing by using Jmeter
We are taking the Example of https://www.ielts.com/ to measure the performance of the website. We perform testing by using 50 users.
Step1:-Add Thread Group
- Select Test plan and add thread group->Add->Threads(users)->Thread group.
- Click on thread group.
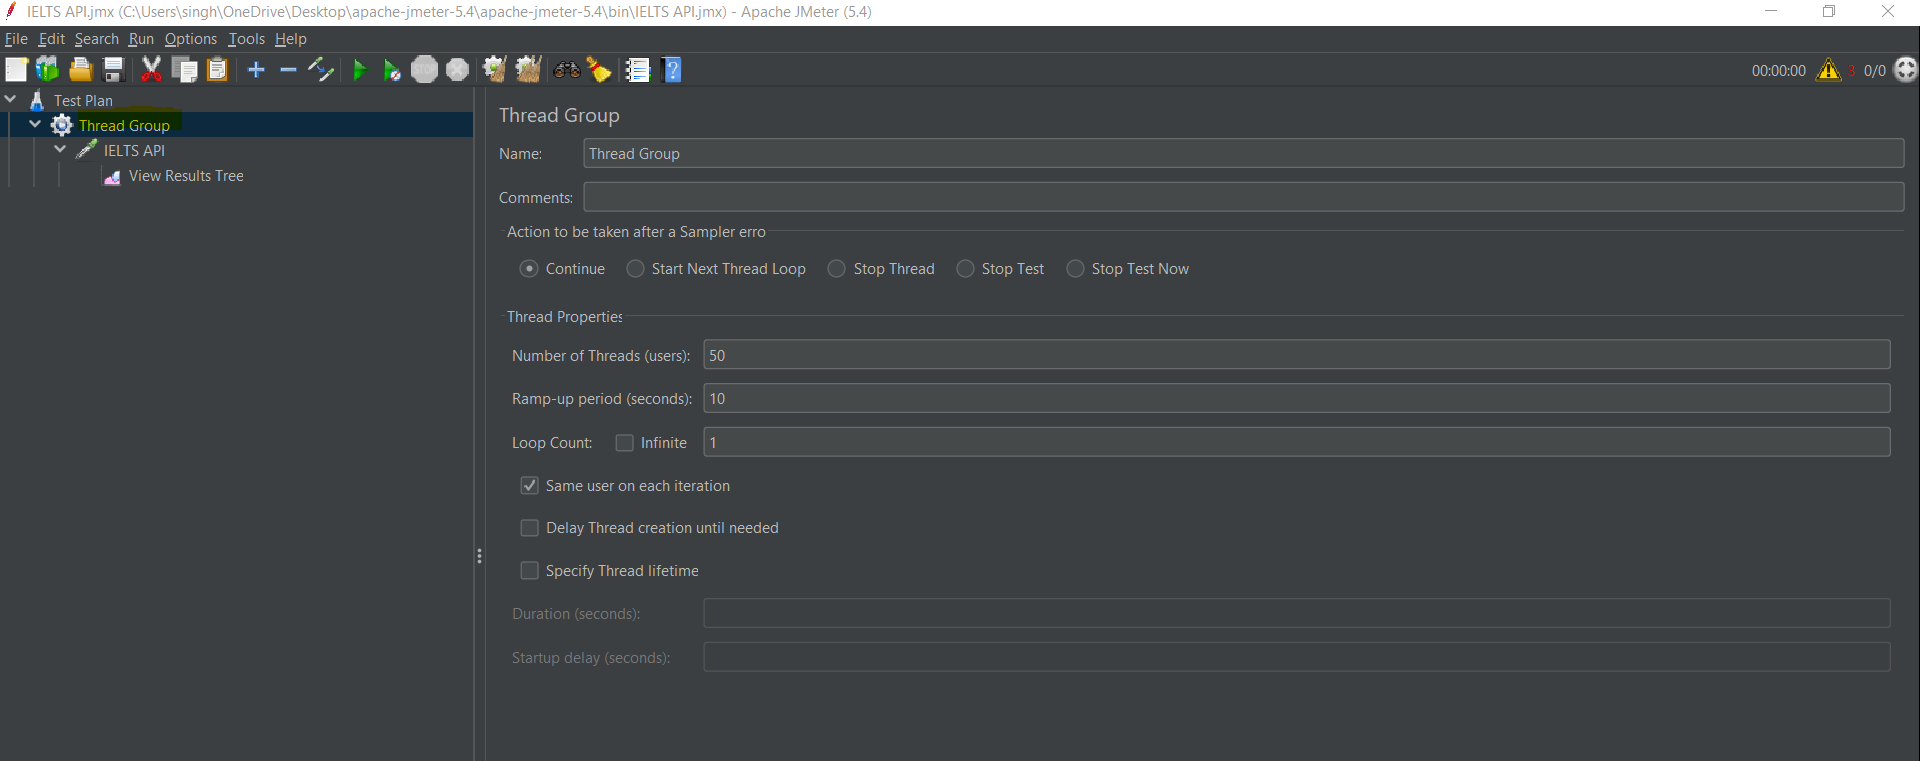
- Now, We can see Below mentioned fields.
- We have to enter Name.
- The number of threads(users): Threads means user.Total numbers of virtual users performing the test script execution.
- Ramp-up Period(in seconds): Ramp-up period defined how much time it takes to execute all thread(users).i.e.Thread is 50 and Ramp-up time is 10 seconds then, it means It takes 10 seconds to execute 50 threads(5 thread per second).
- Loop Count: Loop Count is the number of executions for the script.
Step 2:-Add JMeter Config Element
- Add HTTP Request Default by navigating Add ->Config Element ->HTTP Request defaults.
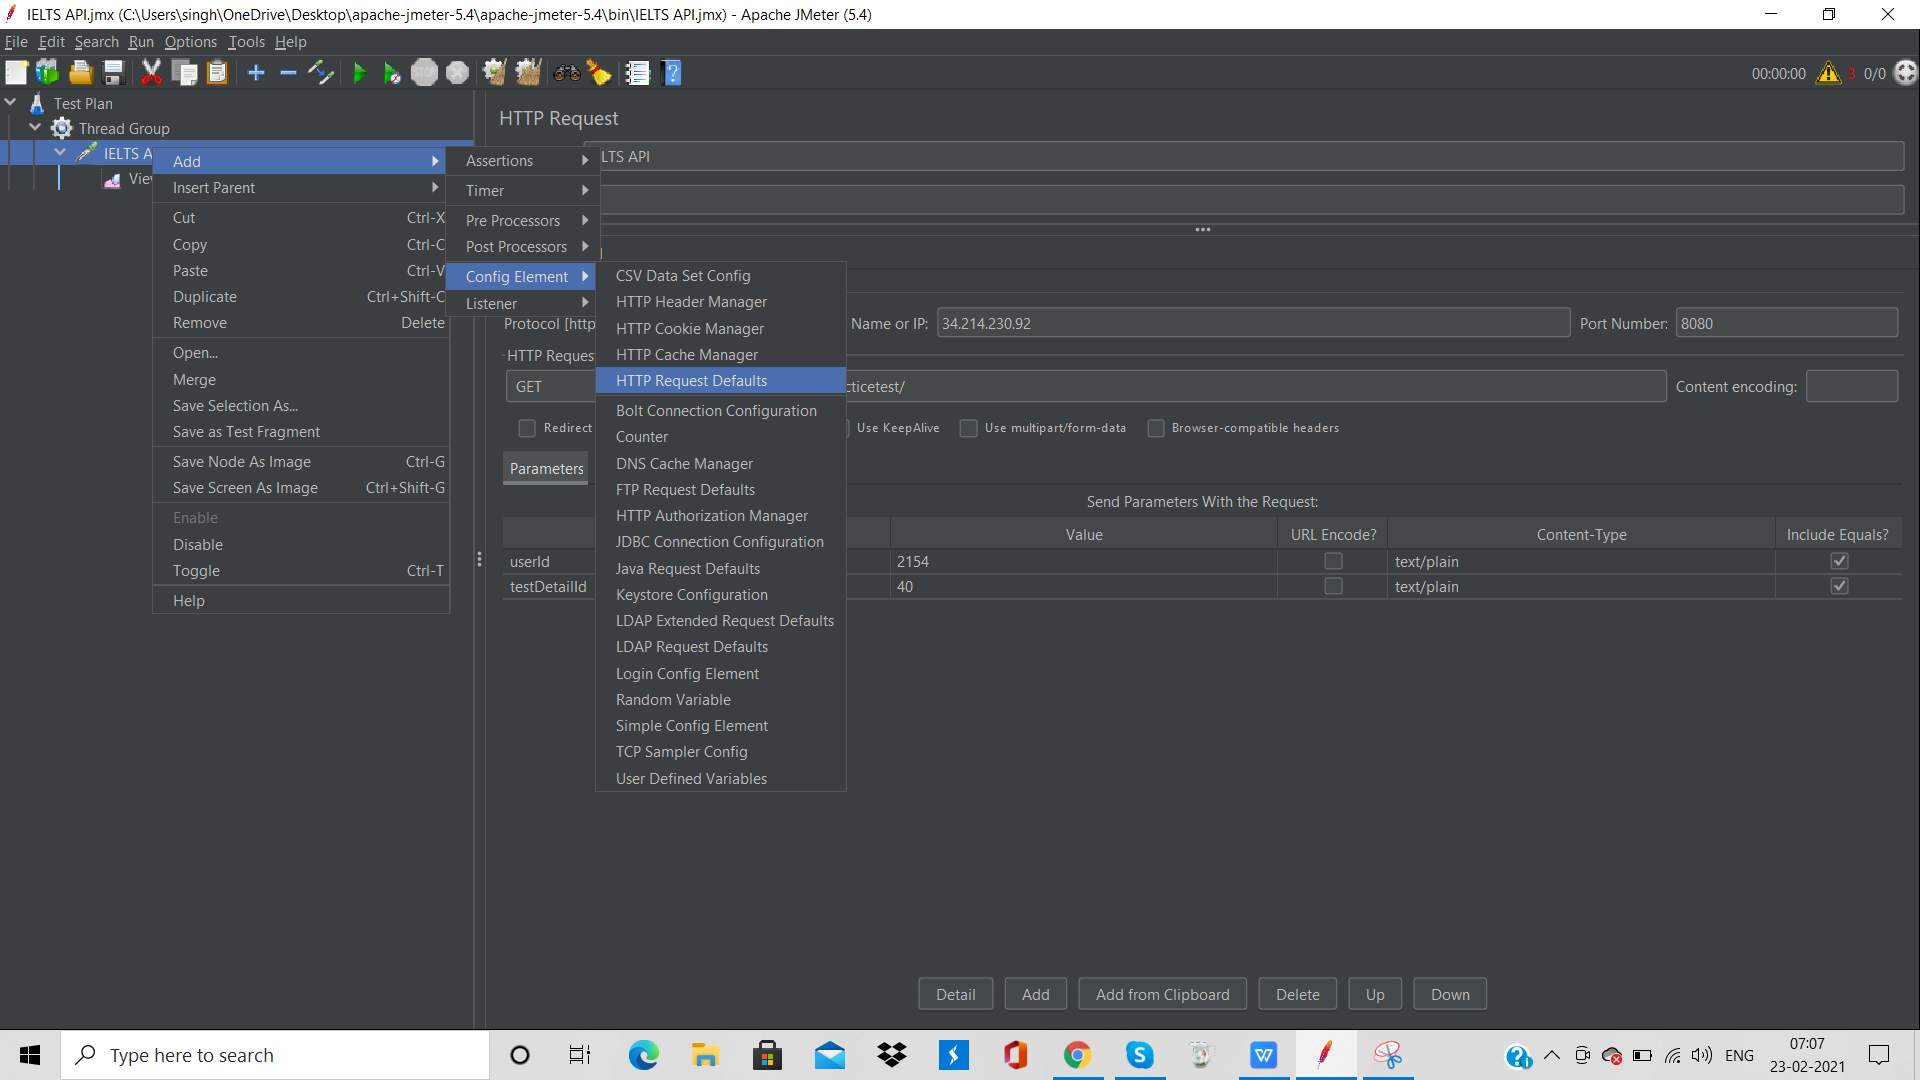
- In the HTTP Request Defaults control panel, enter the Website name which you want to test (https://www.ielts.com/).
- HTTP Request
- Right-click on Test IELTS and navigate: Add ->Sampler ->HTTP Request.
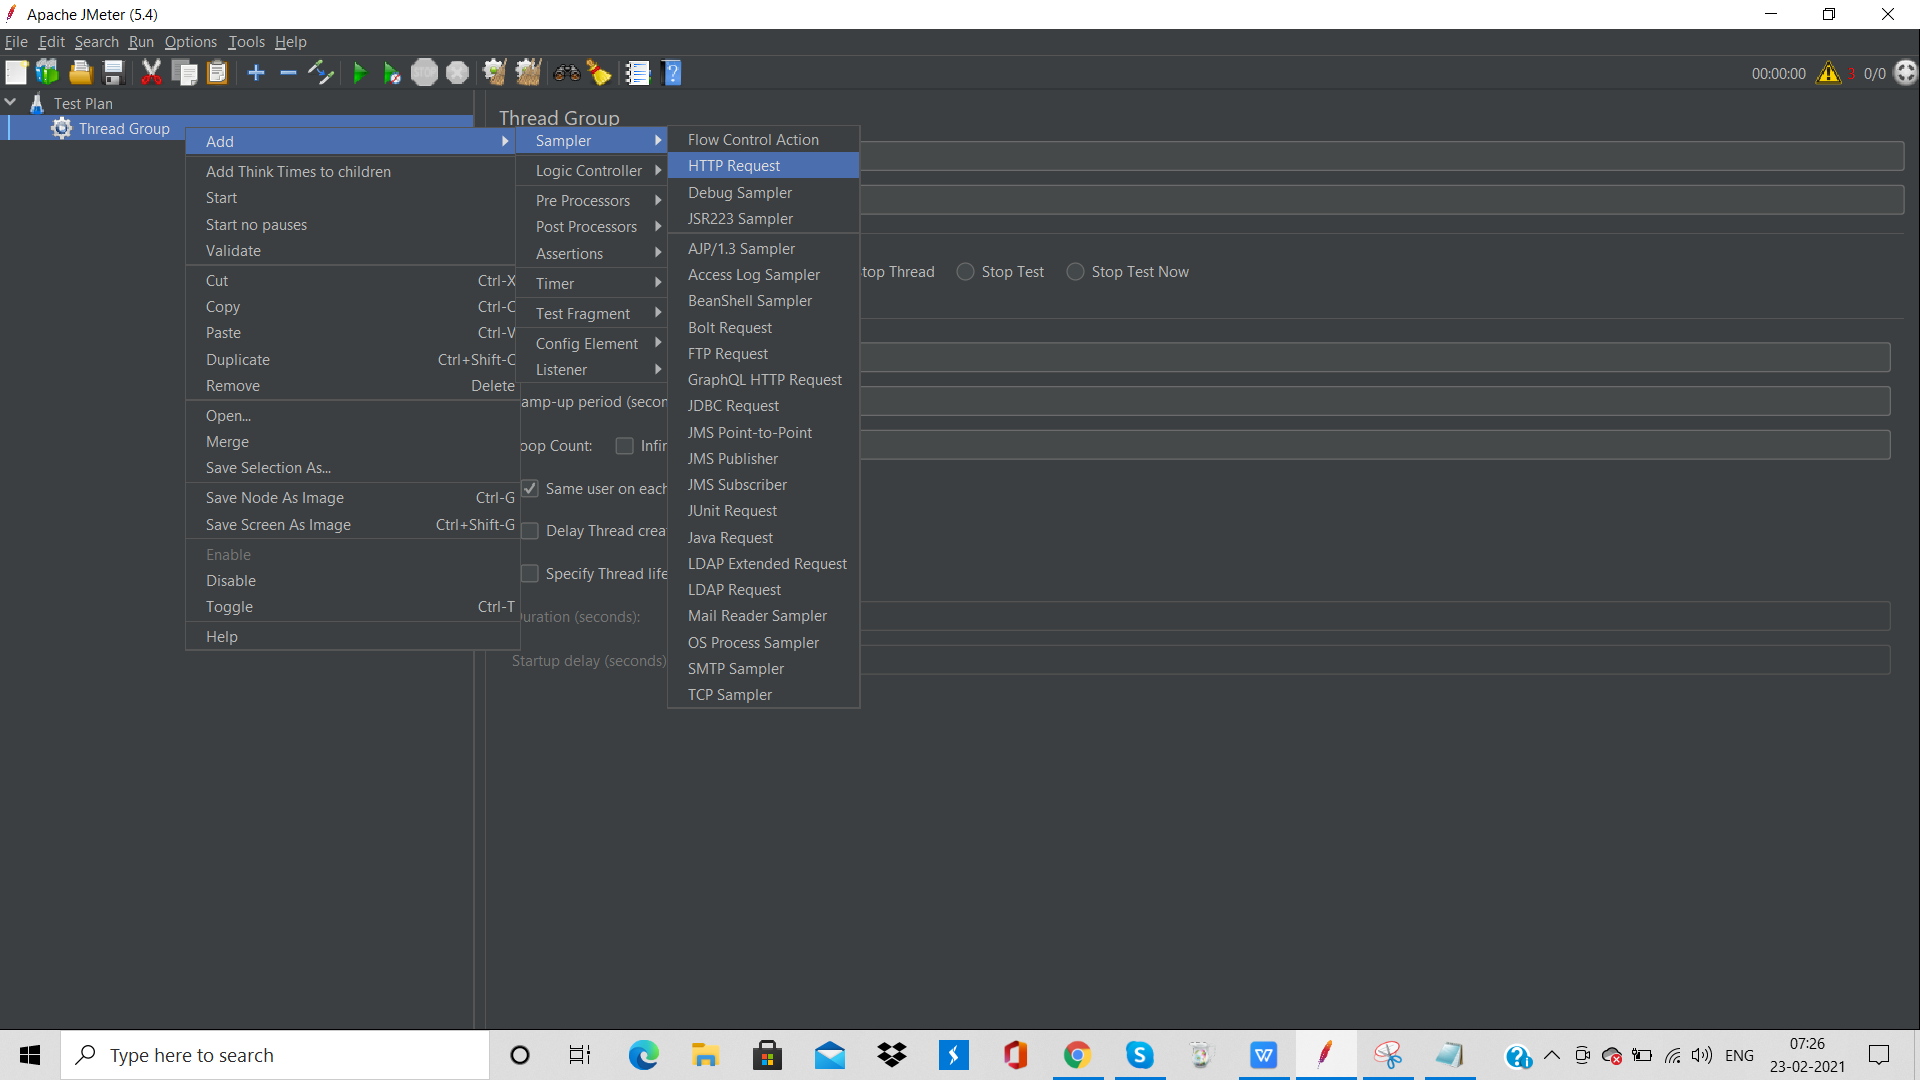
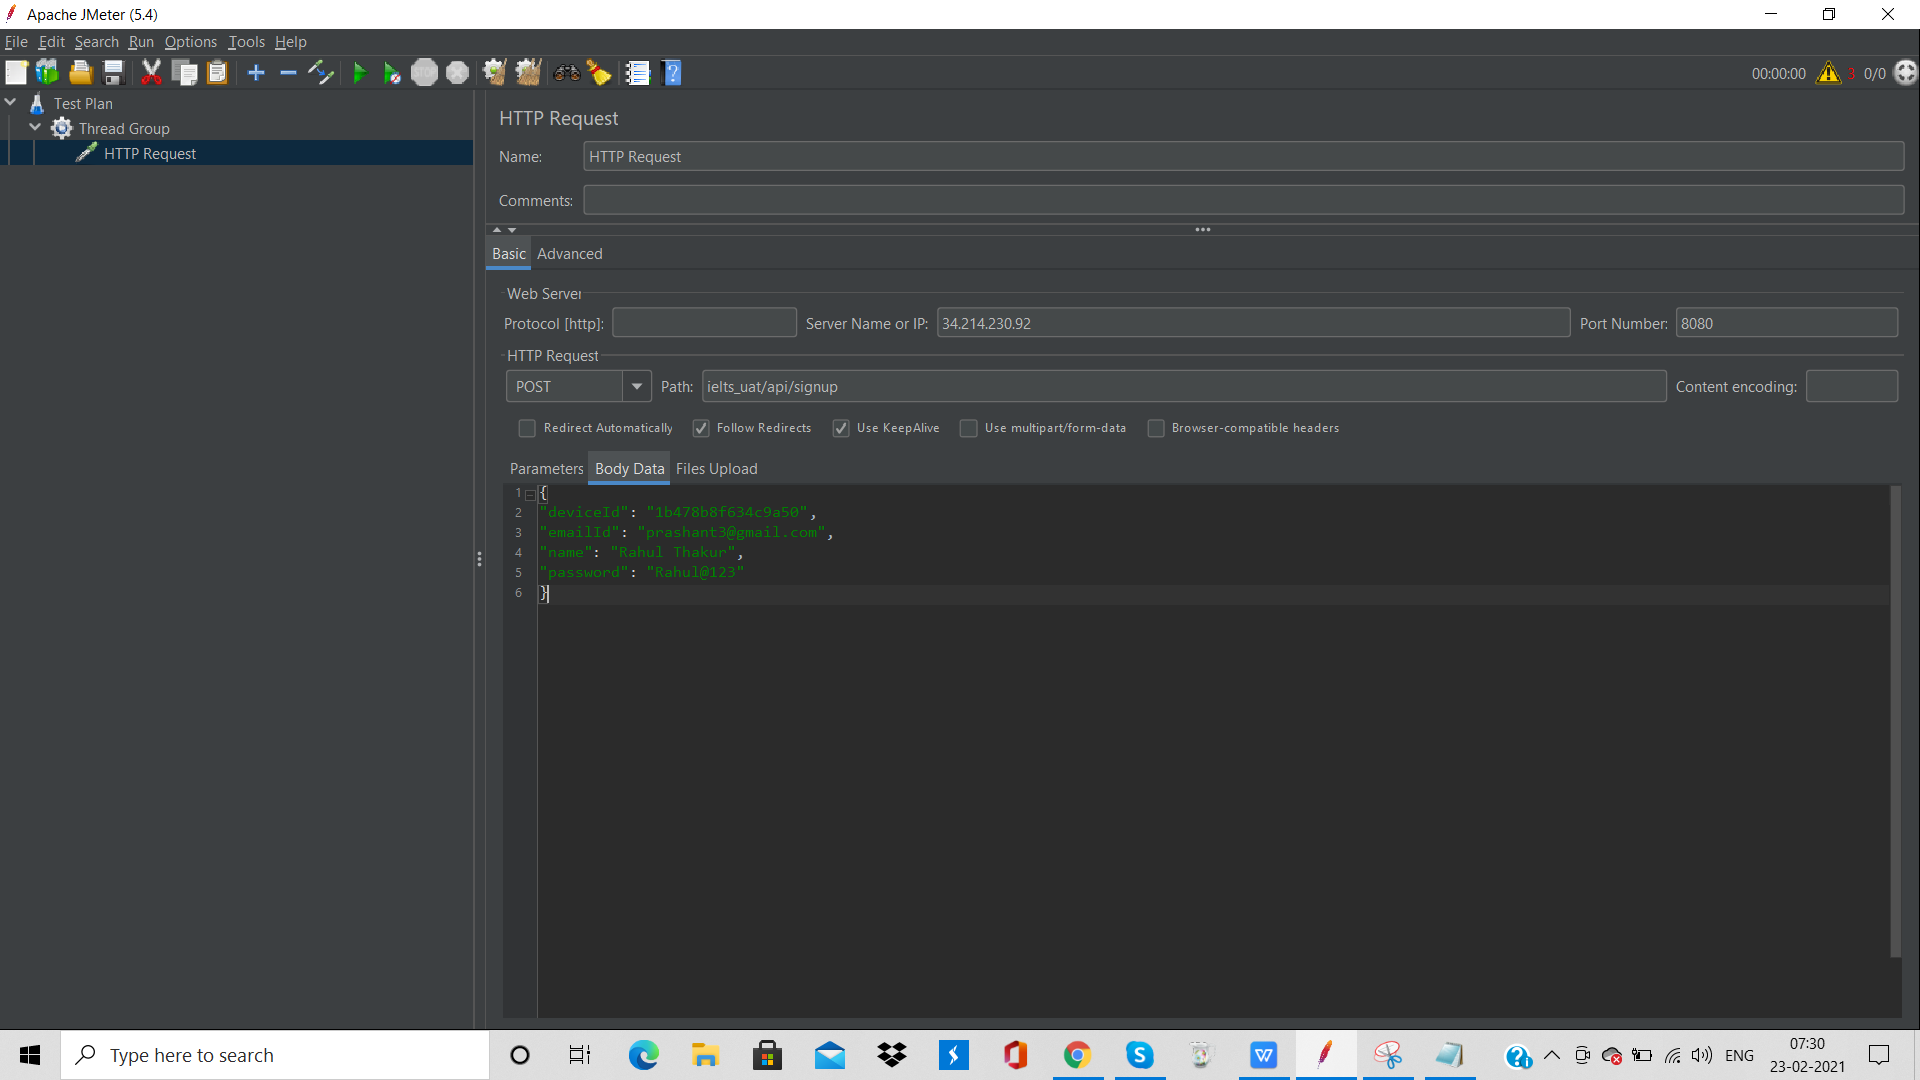
- In HTTP Request Control Panel, the Path field indicates which URL request you want to send to IELTS Server.
- I have entered Blog under the path. It meant that It search http:/ielts_uat/api/signup/
- In Post API we have entered the Request Data and IP address, Port Number Like below:
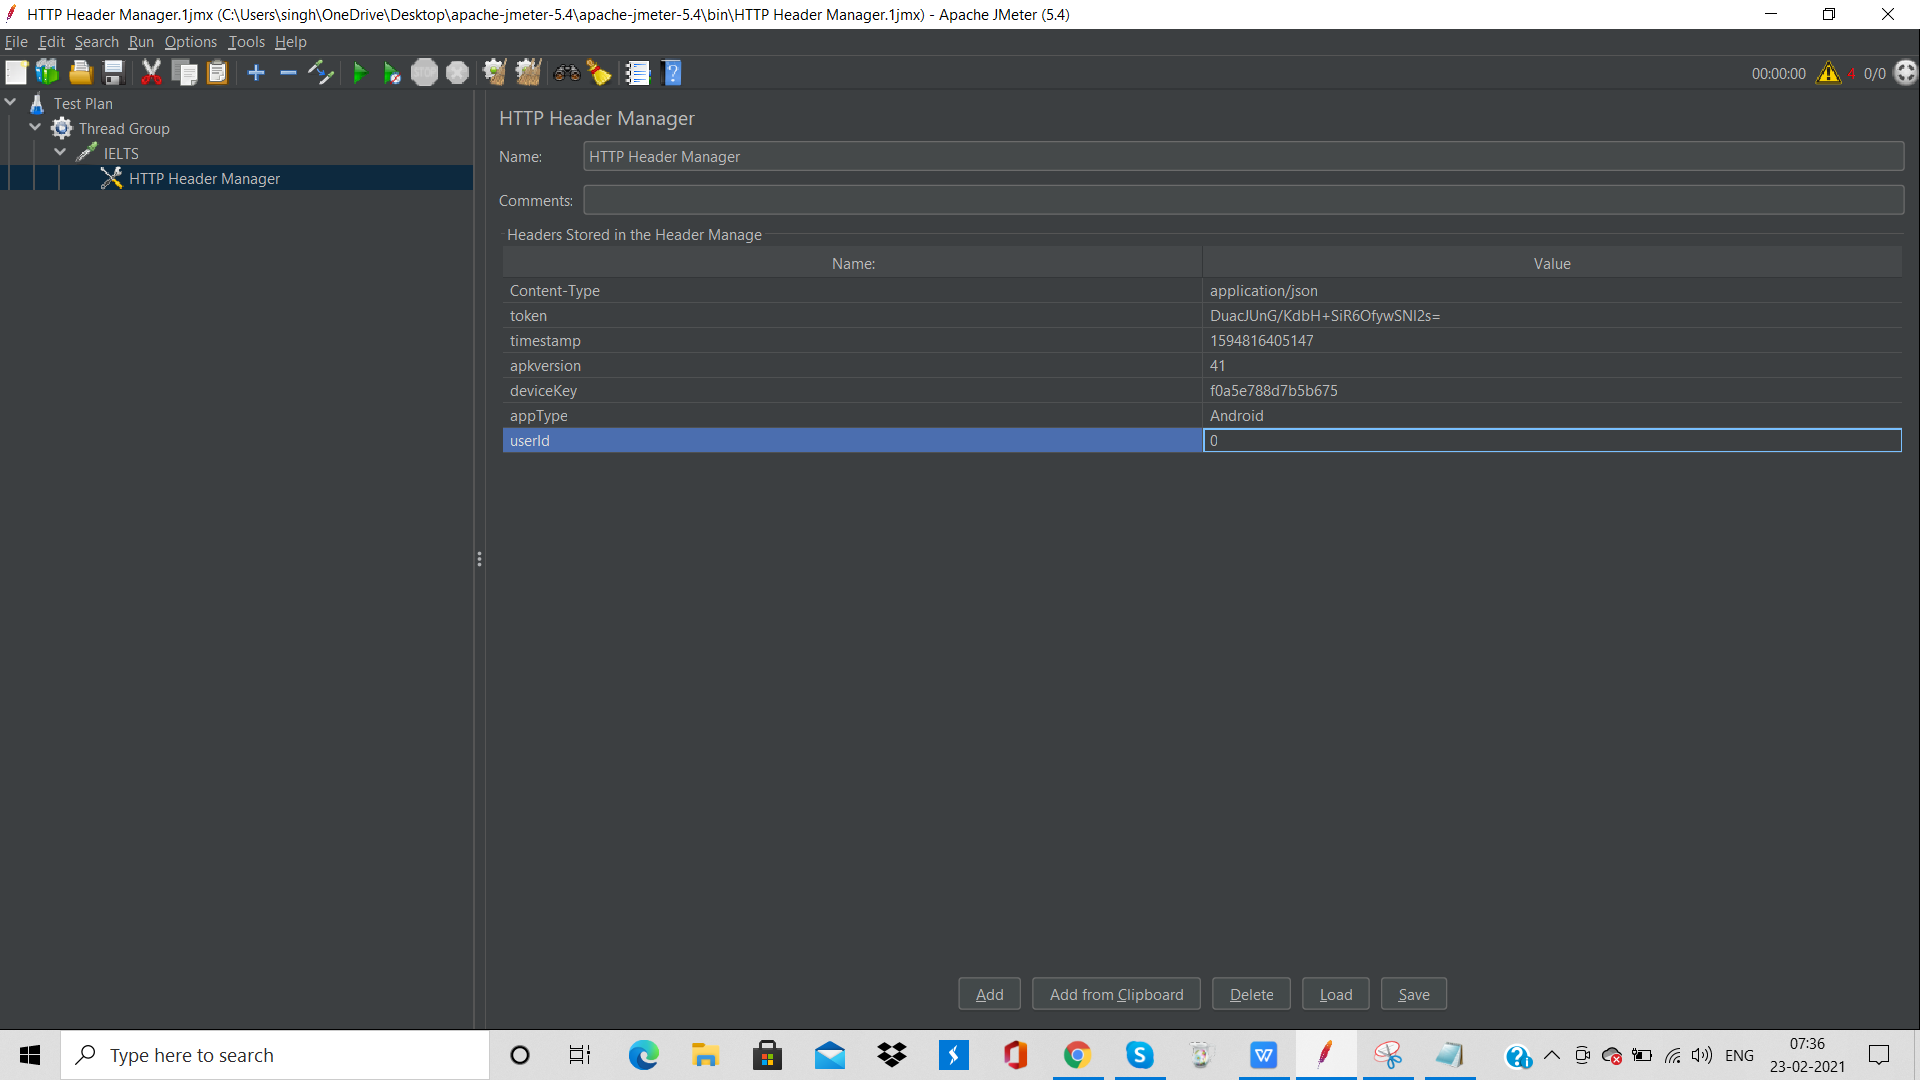
- In the HTTPS header manager adds all the name and their values in the parameter of the request header.
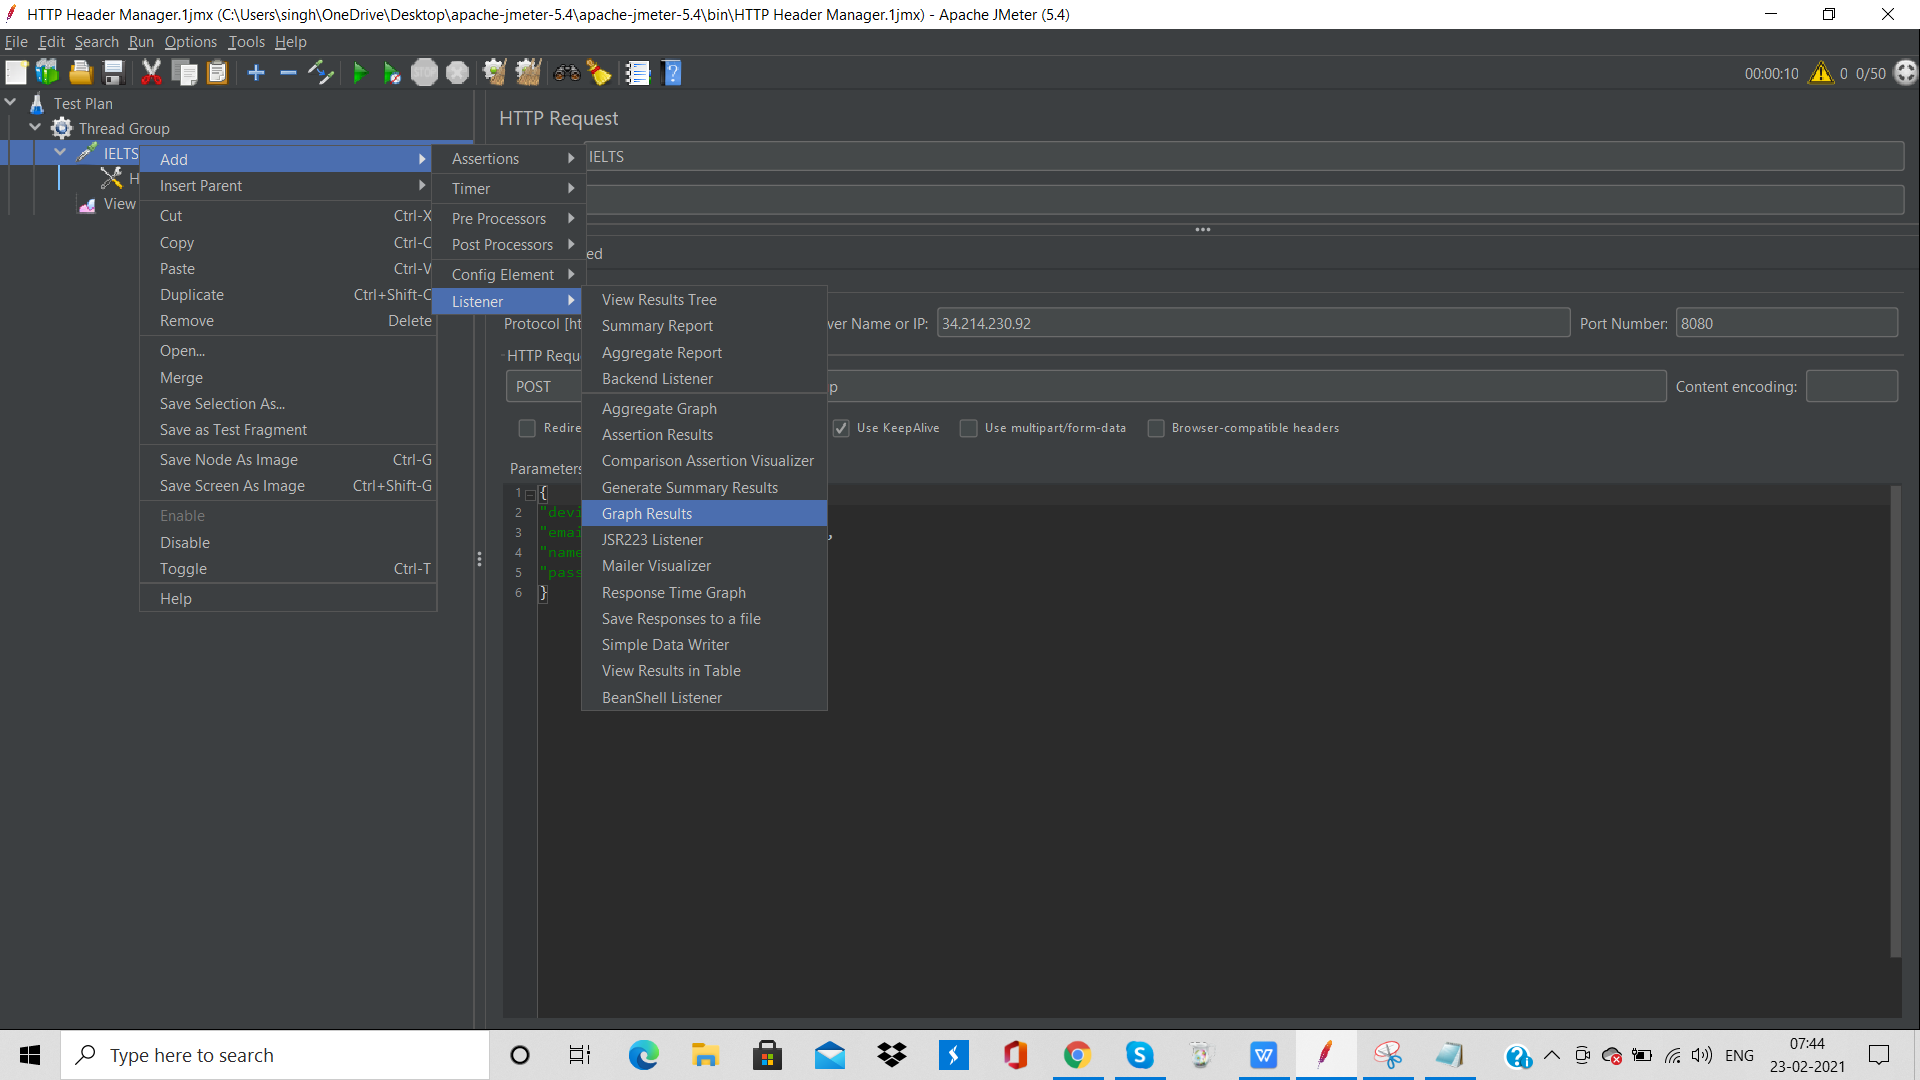
- Add Listener In order to View the Result in Different form Like Graph, Table, Text.
Step3:-Add Graph Result
- Right click Test Plan, Add ->Listener ->Graph Results
- JMeter displays the Result in the form of a Graph.
Step4:-Run Test and get the test result
- Now, We can run by pressing the Run button (Ctrl + R) on the Toolbar to start the software testing process. We can see the test result display on the Graph.
- The picture below presents a graph of a test plan, where we simulated 50 users who accessed the website:
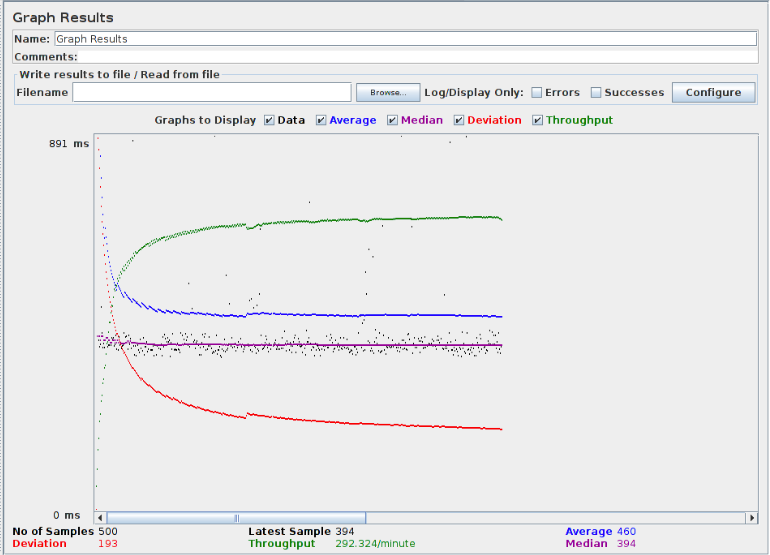
- At the bottom of the picture, there are the following statistics, represented in colours:
- Black: Total number of samples sent.
- Blue: The average samples sent.
- Red: The standard deviation.
- Green: Throughput rate.
- The throughput rate represents the total number of requests per minute a server can handle.
- Now, We analyze the performance of the IELTS.com server.
Throughput and Deviation are the two most important parameters to measure the performance of any software.
- Throughput defines the ability to handle a heavy load, if a server has High throughput it means the performance of the server is also Good as the throughput is high.
- Deviation defines how much the system is fluctuating in real-time.it indicates in red colour. The smaller the deviation means Better the performance of any server.