Apache JMeter is a tool that can be used for load testing to analyse and measure the performance of web applications, mobile applications, HTTP requests, web services, database etc. JMeter simulates the number of users to send requests to the target server and records the stats in various available formats to analyse the performance.
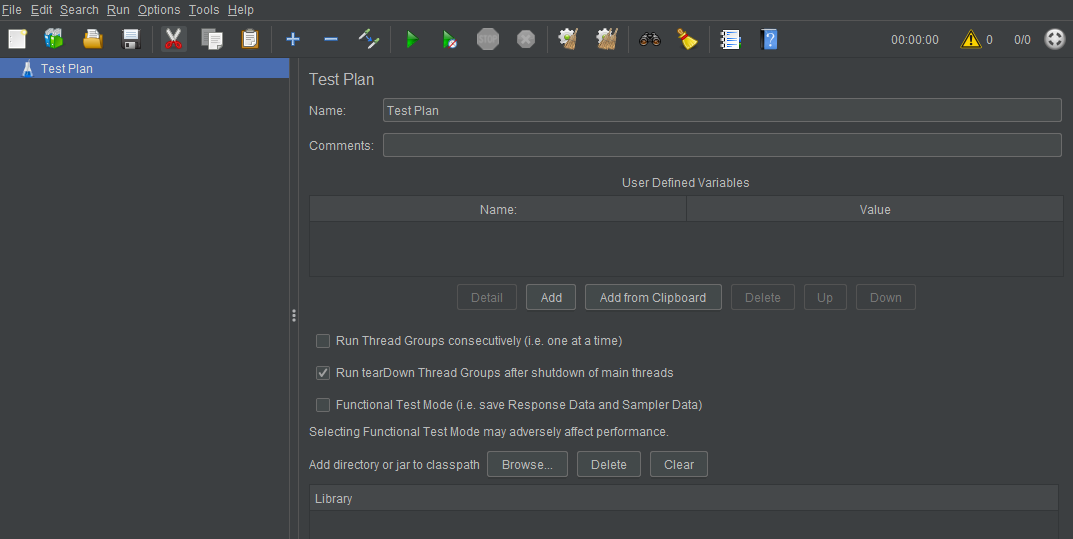
Simply open the Jmeter and following interface will open:

Here the Test Plan acts as a base method, inside which every other part of the plan including configuration, requests type, reporting and views will be created/ added.
How to Setup a test plan –
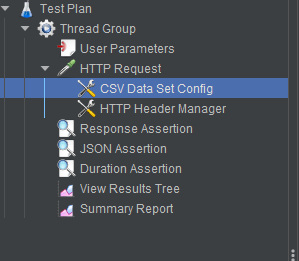
1. Right-click on the test plan and add a thread group.
In the thread group, three components are to be noticed, the Number of threads represents the component where the load is applied. Ramp-up period represents the time the tool should take to execute each thread. Loop Count represents the number of cycles to run per plan.
2. Next, under the thread group a sampler needs to be added. Sampler represents the type of request one is trying to put the load on. The sampler contains HTTP requests, java requests, JDBC requests and many more. Once a type of sampler is selected, User has to input the request type, URL, port number, request type, path if any, parameters and body etc.
3. Next, a config element has to be created. In Config elements there are various available methods such as HTTP header manager, HTTP cookie manager, HTTP cache manager, JDBC connection configuration etc In config element, user can headers required to run the request/ thread. It could be authentications of different kinds.
4. Next, to view the results a listener has to be added. Listeners simply listen to the request and show data as per the type of listener selected. It could be graphs, trees, tables, aggregated results etc.
5. Next there are pre and post-processors and logic controllers, which can either be added or not based on the type of request of the test plan. These could be if, else, while conditions.
6. Then, there are assertions which need to be added to identify various aspects of the requests. Assertion types could be response code assertions, time assertions, content assertions etc.

Now the data provided to the headers, body or any other field could be taken directly from the CSV files. For that parameterization has to be done.
– First, create a CSV file and add the values there.
– create a CSV data set config, and place the location of that CSV file in there.
– Next, replace hardcoded values with the variable name used in the CSV file.
Let’s say the variable name is “DataSet” , then it would be ${DataSet}.
Now one can simply save the file and run it via JMeter application or via cmd prompt.
To run in Non-gui mode, open cmd, locate the file and run following commands:
jmeter -n -t <test JMX file> -l <test log file>
jmeter -Jthreads=1000 -n -t <test.jmx> -l <result.jtl>
– n [This specifies JMeter is to run in non-gui mode]
– t [name of JMX file that contains the Test Plan]
– l [name of JTL file to log sample results to]
– j [Number of thread to run]
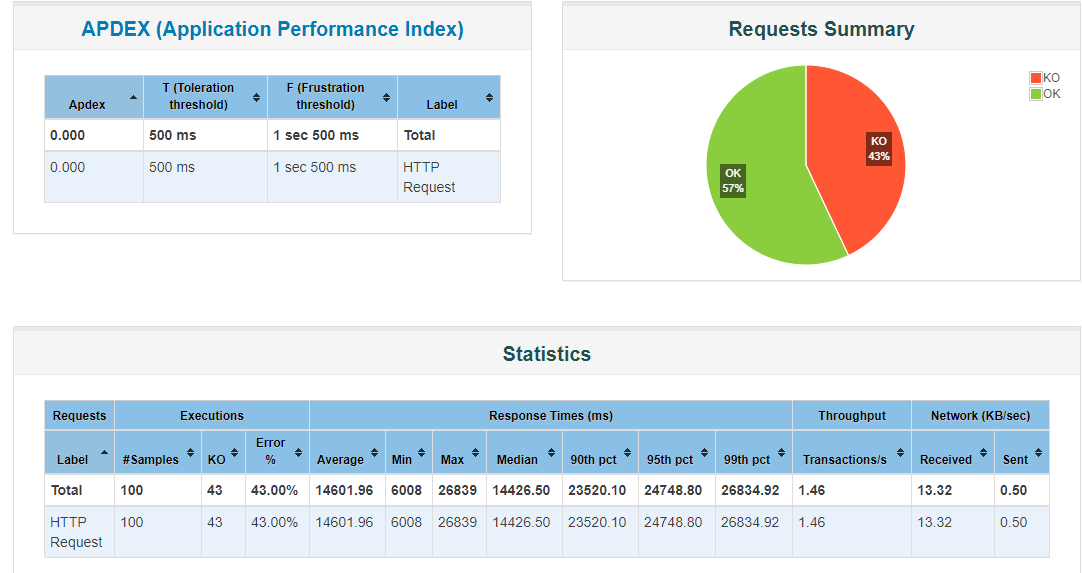
Test report generation –
Generation from an existing sample CSV log file:
jmeter -g <log file> -o <Path to output folder>
Generation after load test:
jmeter -n -t <test JMX file> -l <test log file> -e -o <Path to output folder>

This was a simple demonstration of how to set up a test plan. For different requests it would change.
For JDBC requests the configuration would be different, for websites it would be different, the basic structure will remain the same.
Recording Mobile scripts –
To record mobile scripts, create a recording controller, and set up a port number. Upon hitting start, a certificate will be saved in the bin directory. User has to install that certificate in the mobile device and change proxy settings to manual with the same port number set in JMeter.
Once that is done, the requests will be recorded in the recorder controller of JMeter. After that same process will be followed in putting the load and adding different assertions etc.
Recording web scripts –
There are two ways to record scripts, one is to simply hit start and start using the website and later on filter out the requests captured by JMeter according to requirement.
Another method is to add the BlazeMeter plugin to your browser and hit the record button.
Once the record button is hit, it will start capturing the requests of the pages being visited. This can be saved and later on imported onto the JMeter tool or can be run via the cmd prompt without having to install the JMeter tool.
Database Test Plan –
This is used to test a database server. In this, JDBC requests are sent to the database server to check how it performs under load. To create a test plan, other than basic setup as in thread group, summary, listeners and a request, database driver is required. For MySQL, we’ll download the MYSQL database driver. In that one executable .jar needs to be copied to the /bin directory inside JMeter.
After this, simply add a JDBC request from add menu and then JDBC connection configuration element. In the configuration element, put in the following :
Variable name- Unique name which needs to be the same as in the sample request.
JDBC driver class- com.mysql.jdbc.Driver
Database URL- jdbc:mysql://<server ip:3306>/
Username and Password- abc/ abc
Now the connection of the server has been established. Next, in the JDBC request sampler type in the queries that need to be tested against the load.
Add users and run the request to check and analyse the result.
 End to End Technology Solutions
